BTC DXY BTCDOM TOTAL TOTAL 3 EGLD CRV FIL THETA analysis

The total crypto market cap stands at 1.108 T $ on the 19th of September 2023.
1. BITCOIN
Last report's idea is still in play, but we do have some further development price action that should help us move on with our trades. Keeping previous chart as reference :

Updated on weekly :
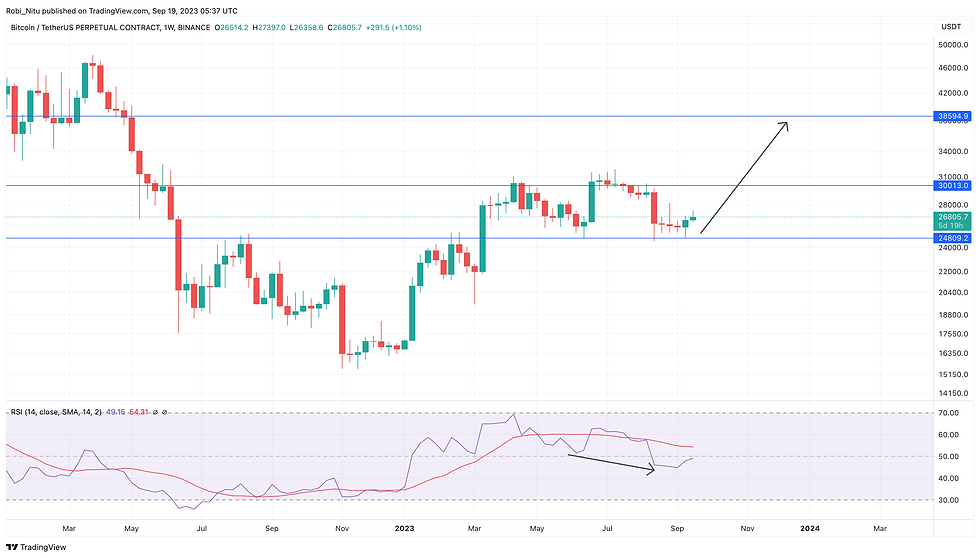
We're seeing the hidden bullish divergence playing out as we thought previously. We now have a green close on last week's candle and a green one so far this week. Would love to see price get back over the 30k area with a weekly close in order to be "sure".
For now our yearly plan is still valid, the correction stopped and bounced from the 0.382 fib retracement level as expected. This is in line with the Elliott waves expanded triangles formation that we are watching develop since November 2022.
The full plan is here.
Going to daily chart :

I'm watching the 0.618 fib level for a daily dose in order to enter / double positions. After this happens we have our first target in the 29 k area.
I am going to trade this setup as follows (same setup as 10 days ago) :
Long: 4h close over the 27.200$ area targets the 31k area.
Short : 4h close under 25.200$ targets the 23.300$ and 21.700$ areas.
Will update with my personal trades on the live trading channel (trader & VIP membership).

2. DXY
Had 9 weekly closes in a row. Usually this would mean very bad news for cryptos, this time it's different 😂. Although altcoins kept going down we also had some great moves on some in the past 2 weeks (UNFI 3x) which would suggest that we finally hit bottom.
DXY weekly chart :

Key points :
DXY had another push over the 105 level forming yet another bearish divergence in the process
we're not in the overbought area on RSI 14,
confirmation of rejection here "should" send the price under the 100$ levels in the coming weeks
invalidation of bear div would send it higher to the 106$ levels
if DXY rises we will probably see BTC correlated at the 21.700$ levels
there is no significant demand or explanation for a strong dollar other than people holding on to savings, when the time is up so will be the risk-on assets

3. BTCDOM
Previous idea turned invalid at the 1860$ level. I considered that possible scenario in our last report.
This is the updated chart :

Although we had another push based on the hidden bullish divergence that formed and invalidated the bearish one on the daily timeframe we are still pretty high up on the chart and a correction will "surely" follow.
Currently watching for a rejection from the 1966-2082$ fib levels marked on chart. "Should" visit the oversold area after this happens.

4. TOTAL mk
Nothing much changed here either, only 30 bil $ back in the last 10 days. Keeping both charts for reference :
last weeks's chart :

This week's chart :

We're noticing the same bull div with the RSI coming out of oversold as we do in BTC's case. This "should" send the price in the overbought area eventually.
On Ichimoku we are holding the lower part of the cloud. I'm expecting a push to the upper side of the cloud at the 1.47 T $ levels. Go above that and next target sits in the 2 T $ area.

5. TOTAL 3 - altcoins market cap
In my last report I was saying :
"Seems we had a breakout and a retest on the broken diagonal resistance and we may be turning it into support. This is what I'm watching :

Nothing much changed, this is the updated chart :

Current evolution :

RSI is over the 50 pain area while STOCH already performed a reset and is going back up. The fact that we are seeing HL's even though DOM is till going up makes me think are finally ready for some upside.
Key points :
broken downward trendline and retested for support
golden cross/death cross negotiation
if support holds we should see a move up to the 4oo bil $ area
estimated top before correction in uptrend : 600 bil $ area
--------------------
ALTCOINS
6. EGLD
We managed to hit the level at 22.05$ and bounced to 26$. The strong bounce is correlated with the movements seen on Total 3.

If indeed we get another correction before continuation it shouldn't go under the 23.9$ area. This corresponds the 0.618 retracement fib level needed to confirm this is the second wave of the impulsive EW structure.
For now we are seeing a hidden bull div and an ascending triangle that should push the price to the 29$ area.
7. CRV
It had some hacks, it had some selling. CZ is backing them publicly so ... let's se what the chart tells us :

For a quick trade it seems it's targeting the 0,48$ area, a 10% increase. If/when we get there I"ll update the trade on the live trading channel.
8. FIL
Alongside eGLD this is one of my biggest bags. ... and it's finally moving again. Already took some great trades in January-February when it did an easy 3x. Expecting more.

Chart looks similar to egld's and will probably perform the same.
If we get the correction it "should" not go under 3.13$.
9. THETA
Also one of my biggest bags, currently holding open long position on coin-m.

After breakout and succesful retest on the descending channel I'm looking to double position. Currently in consolidation in th 0.6$ levels for a few months already. I expect the breakout to be fabulous. Resistance levels marked blue on chart.
I'll keep updating the trades on the live trading channel.
-----------------------------------------
If you find the information useful you can subscribe for more services here.
Go bulls !
---
Disclaimer : the opinions presented in the following report are my own and DO NOT CONSTITUTE FINANCIAL ADVICE. Cryptocurrency trading is a very risky endeavour. You can and probably will lose your money if you do not do your own research.
Comentários